

Amazon CloudWatch is a component of AWS that provides detailed monitoring data, in near real time, for AWS resources and workloads running on AWS infrastructure. There are currently over 60 core AWS services that publish metrics to CloudWatch. It collects system-level metrics from Amazon EC2 and from on-premises Linux or Windows servers. Beyond default metrics like CPU usage, disk read/writes and network in/outs metrics – if specified – CloudWatch can collect memory usage, swap usage, and netstat and processes metrics through a CloudWatch agent. You can also retrieve custom metrics from your application or other services using a CloudWatch agent with a StatsD or collectd daemon. CloudWatch stores collected metrics for up to 15 months. Users can then search, graph, alarm and send email notifications based on defined rules (AWS SNS) and automatically scale resources by initiating and terminating EC2 instances (AWS Auto Scaling). You can even retrieve metric stats and perform metric math.
OK then, so why would you want to use an additional tool like Wavefront for monitoring? Well, CloudWatch is a good start for monitoring features, but you’re going to need a lot more to assure the quality of your cloud applications for your users. Gathered from our customers, here are the five top reasons for augmenting CloudWatch with a tool like Wavefront:
1. Expand Visibility to All Services of Your Full Stack, Beyond Just AWS
CloudWatch monitoring is restricted to metrics from on-premises servers and AWS resources. As such, CloudWatch doesn’t aggregate or correlate metrics across different, distributed and decoupled deployments. For correlation, you need a different tool that complements CloudWatch. Wavefront correlates monitoring and analytics across multi-cloud environments, including all the top cloud providers, AWS, Google Cloud Platform (GCP) and Microsoft Azure (Figure 1). Using Wavefront’s 160+ built-in integrations, you can easily visualize, analyze, and alert not only on metrics from multiple cloud services but from different workload environments such as Kubernetes, Pivotal Container Service (PKS), VMware vSphere, web apps, data stores and metrics from instrumented applications code.
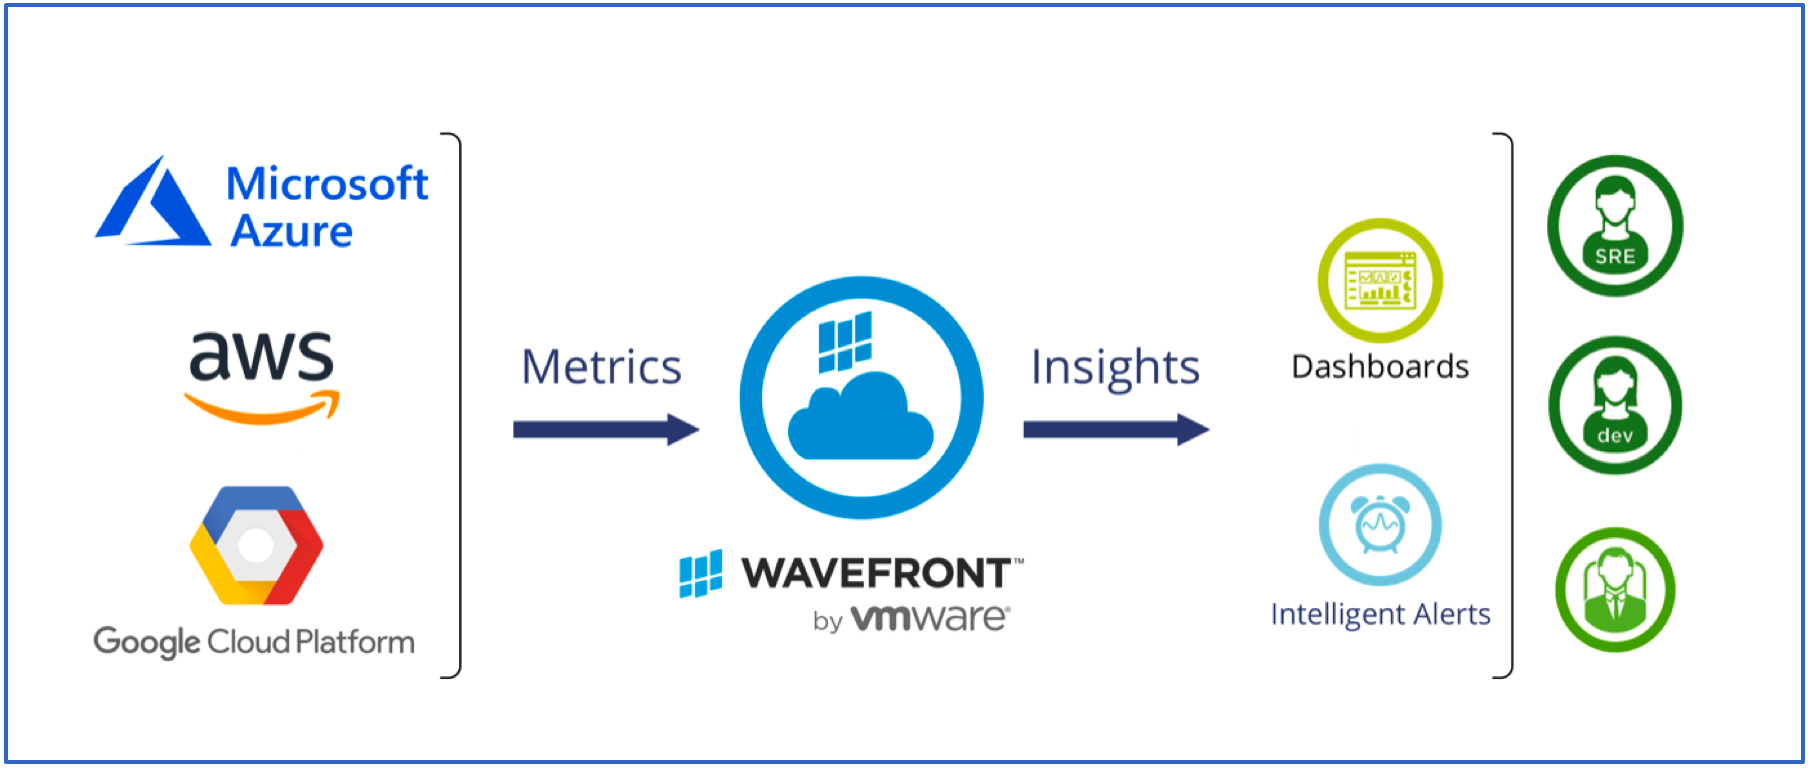 Figure 1. Wavefront Across Major Public Cloud Real-Time Visibility
2. Combine the Global View Across Your AWS Environment Health with a Deep Dive Quickly Across Layers
CloudWatch visualizes key single-instance, system-oriented metrics, but it alone can’t show overall AWS environment health at different levels of aggregation. Overall, multi-level views enable quick identification of trouble spots. Wavefront added to CloudHealth reduces AWS incident resolution from hours to seconds using interlinked out-of-the-box dashboards for a comprehensive multi-level view of your complete cloud infrastructure. Wavefront’s globe chart best illustrates your AWS infrastructure health across worldwide regions, plus Wavefront’s node map chart shows you region-specific metrics of your EC2 instances. You can drill through to troubled instance quickly and identify the root cause at a glance.
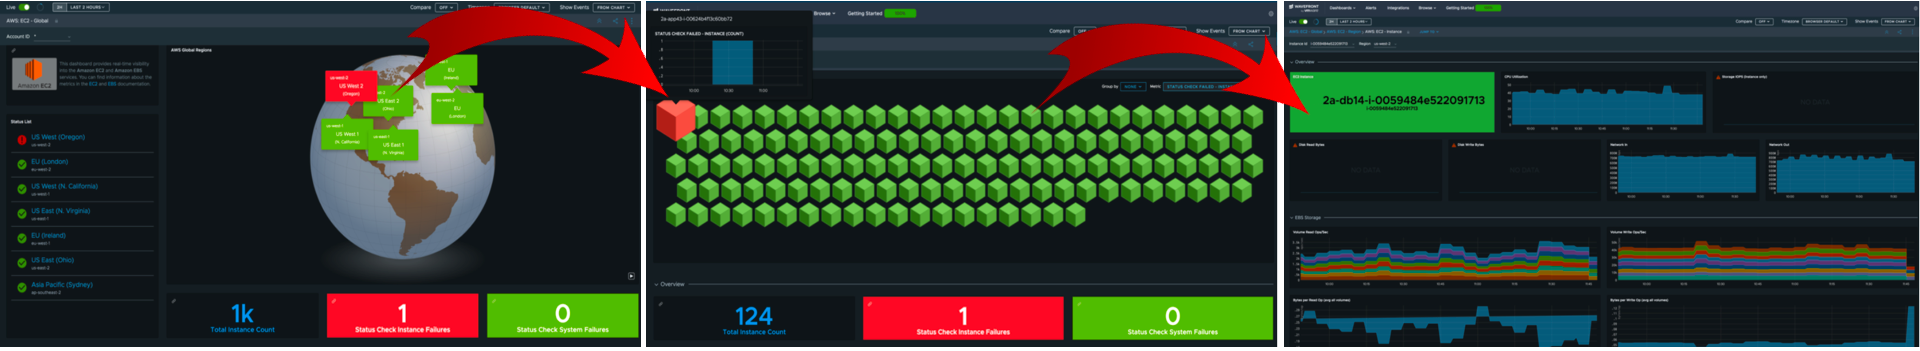 Figure 2. Wavefront Interlinked Multi-View of AWS Infrastructure
3. Troubleshoot Microservices Faster with Metrics, Histograms, and Traces
For troubleshooting applications that use AWS ECS or AWS Lambda, CloudWatch offers only complex logs. Consider instead using Wavefront’s 3D Microservices Observability, the unique combination to monitor out-of-the-box metrics, histograms, and traces at cloud scale with over a million data points per second. Metrics tell you system-wide when there is a problem. Histograms can overcome the limitations of averages and find problems with high-speed metrics like sub-second response times and latencies. Distributed tracing, with visibility into entire API call flow, lets you drill down and isolate issues between microservices. In short, a single platform that unifies metrics, histograms, and traces significantly reduces MTTR.
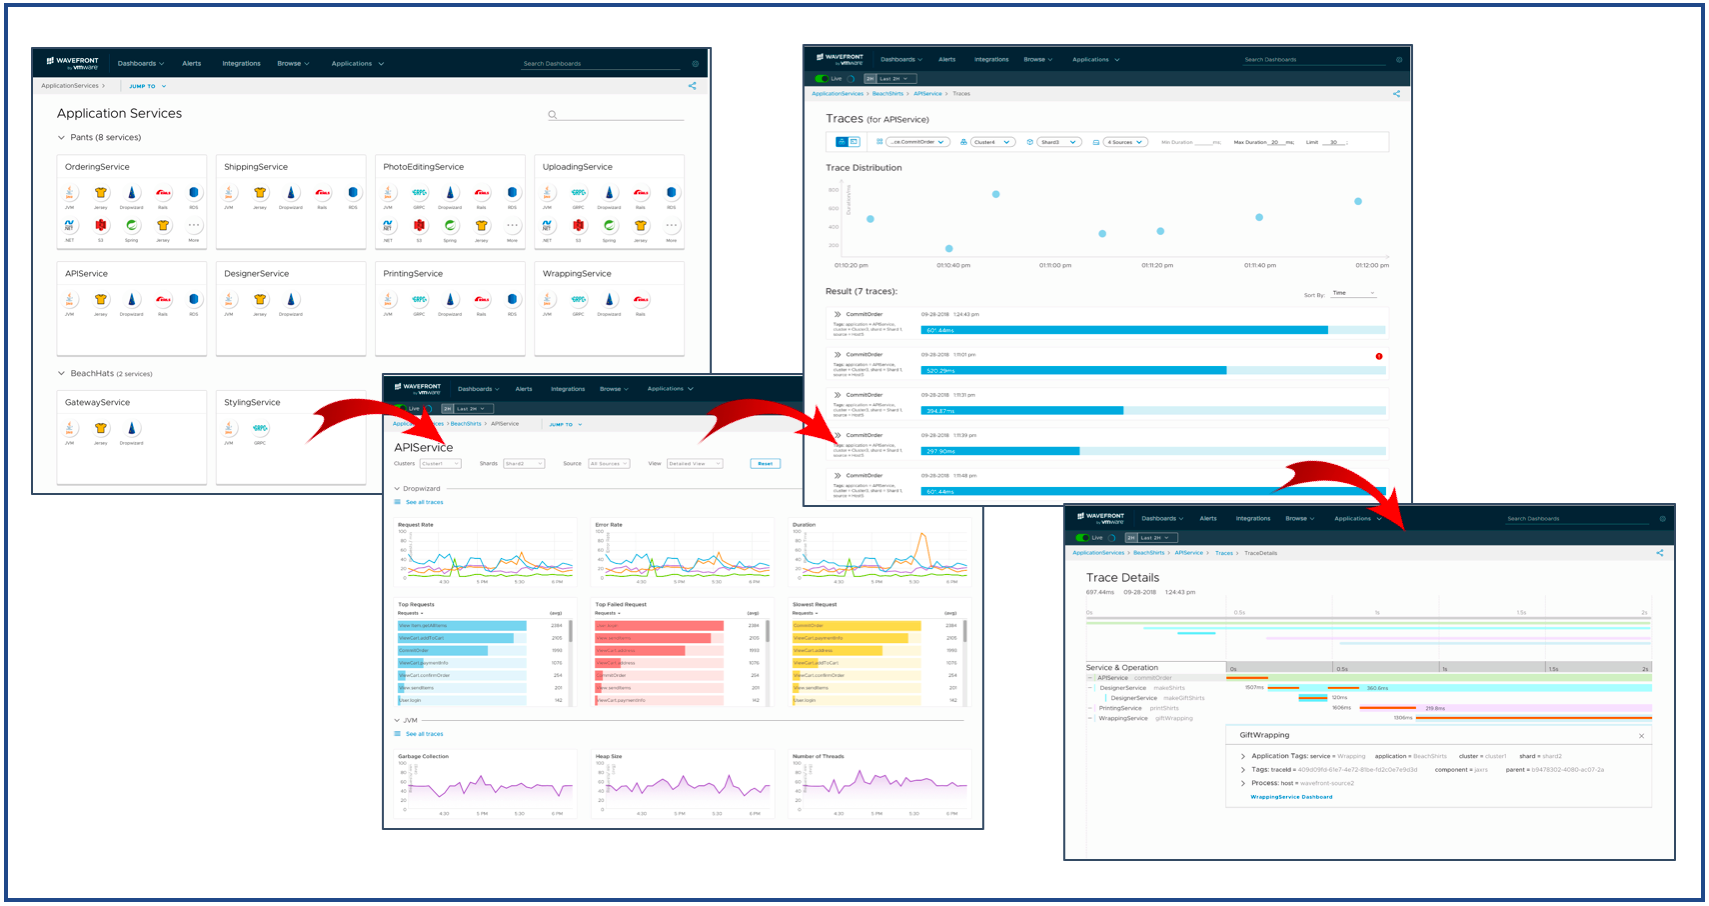 Figure 3. Wavefront 3D Microservices Observability – Metrics, Histograms, Traces – Go System Wide to Detailed Flow for Faster Troubleshooting
4. Enrich Your Analytics Functionality and Empower Novice Users
CloudWatch offers 13 elementary math functions that you can use to query CloudWatch metrics and create new times series based on these metrics. Using Wavefront, you expand to 160+ analytic functions, from aggregation and raw aggregation, filtering and comparison, standard time and moving window time, conditional, rounding, missing data, metadata, exponential and trigonometric, predictive and histogram, event and miscellaneous functions.
That’s jet fighter analytics power for the advanced user, but what about the novice user? Well, for users who want to experience full Wavefront power but don’t have the time to build their own analytics models, Wavefront is offering AI/ML assistance through AI Genie. AI Genie uses patent-pending AI/ML technologies to automate anomaly detection and forecasting for any time series metrics, for AWS resources and the application workloads that run on AWS infrastructures. CloudWatch doesn’t offer AI/ML, so Wavefront is a perfect compliment in this regard.
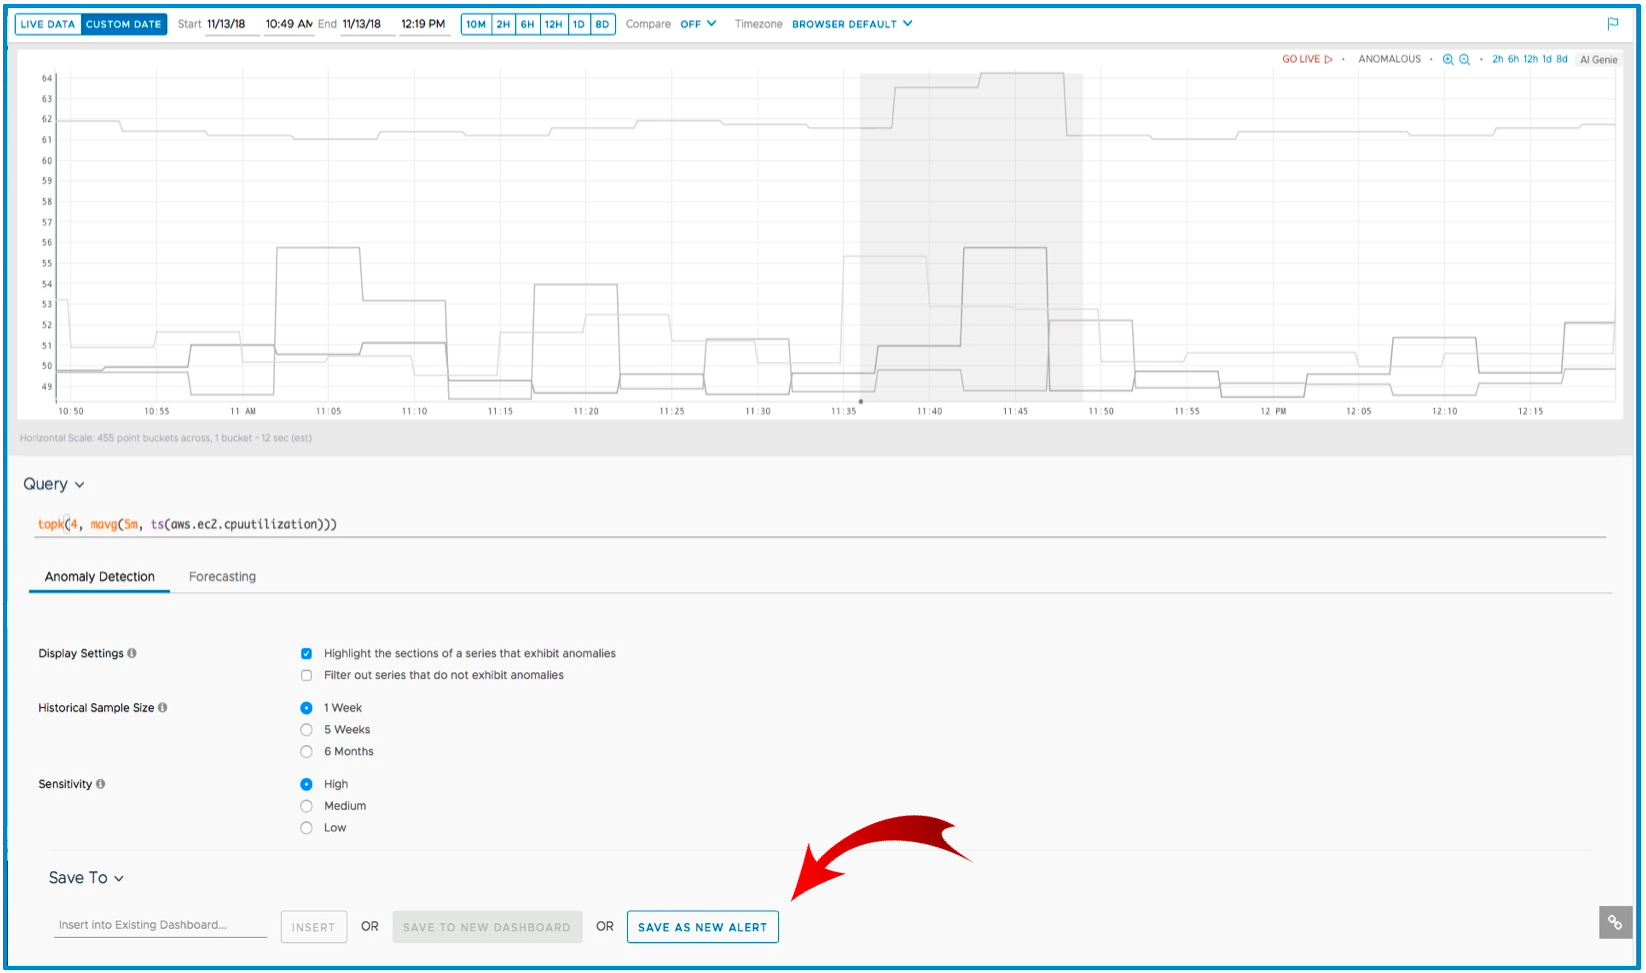 Figure 4. Wavefront AI Genie Automated Real-Time Anomaly Detection on Streaming Metrics
5. Smarten Your Alerts and Get Notified on Real Issues, not False Alarms
With CloudWatch, you’re limited to set basic alarms based on rules created on the most math functions, alert notifications are also limited, as well as the automated actions you’re able to take. With Wavefront Alerting there are no limits. You can fine-tune your alarms using the industries most advanced query language and analytics engine, using any single or combination of 120+ analytics functions on one or multiple time series metrics. Alert notification targets include email, PagerDuty, OpGenie, Slack, and more. You can even use AI Genie to find an anomaly or predict bottlenecks, then create an intelligent alert for critical incidents directly from AI Genie.
Greatly Expand on CloudWatch – What Are You Waiting For?
These are just the top 5 reasons to enhance your Amazon CloudWatch metrics monitoring with Wavefront – hopefully they inspire you to try Wavefront. You’ll immediately see the value of Wavefront with a clearer understanding of application workloads on AWS infrastructure. With this great visibility and analytics power, you will see problems earlier, troubleshoot faster, optimize performance systematically and report on improvements across the organization. As a summary, refer to the table below to see all you get in using Wavefront on top of Cloudwatch.
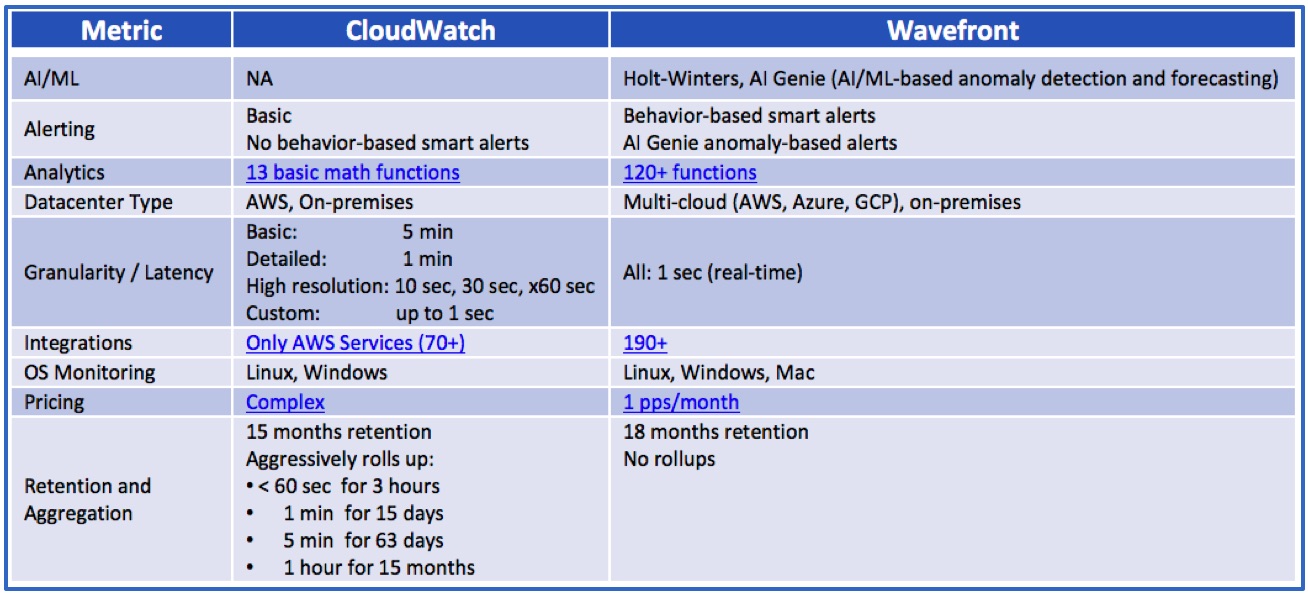 Table: Ways that Wavefront Expands on CloudWatch
Get Started with Wavefront Follow @nesgor Follow @WavefrontHQ
The post Top 5 Reasons to Enhance Your Amazon CloudWatch Metrics with Wavefront appeared first on Wavefront by VMware.


