

Metrics and logs are two important data types in monitoring. Log monitors are optimized for storing, indexing, and analyzing log data.
Wavefront is optimized for time-series metrics data, so it’s awesome at helping you use metrics and analytics to better manage cloud applications.
Wavefront renders metrics visualizations at the speed of thought, at extremely high ingestion rates and processing volumes.
There’s huge value in collecting metrics from every corner of your environment (including from log data), then aggregating them to a single, metrics data store for unified analytics and alerting.
Particularly at scale, processing time-series metric data is different from processing log data.
Wavefront is very economical for managing metrics. It’s offered as a cloud service, and it’s pricing is based on ingestion rate, not on volume stored in the service (Wavefront doesn’t downsample or roll-up historical data). Unlike on-prem tools, there’s no ever-increasing storage hardware costs.
Usually, the best way to send metrics to Wavefront is to do so directly (e.g. we have client libraries in Java and Ruby).
However, sometimes you have a legacy system, say an application system that is difficult to modify. You want to garner metrics from its log data, and add them to your Wavefront metrics data store. For a variety of reasons, you want to get the log monitor out of the loop of this ingestion process.
There are several ways to do this in Wavefront now (and even more ways to come in the future in how we’ll work with log data). One way to generate logs-based metrics is to use the tail plugin for collectd, a metric collector that Wavefront supports.
By reading log files, it can count the number of log entries you specify using regular expressions, e.g. producing a metric that is the count of a particular error.
Another way of turning logs into metrics that’s gaining momentum across the Wavefront customer base is detailed here. It uses the Wavefront Proxy with Filebeat, and we’ll go over a setup now. This is supported in Wavefront Proxy v4.1 and onwards.
Summary Architecture
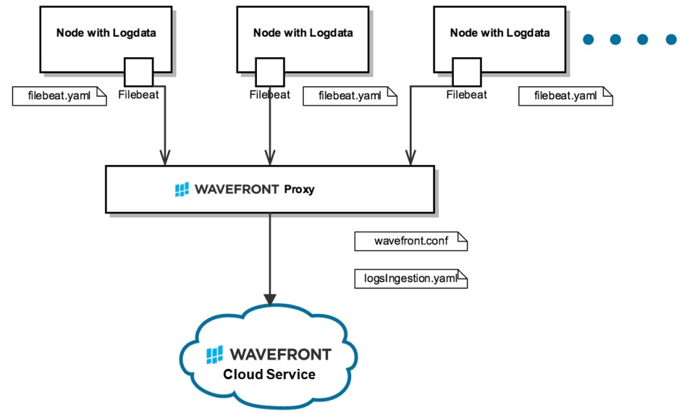 Wavefront’s Direct Logs Ingestion Architecture (using Filebeat)
First we’ll configure the Wavefront Proxy to accept and parse incoming log data. Then we’ll install Filebeat on nodes for sending log data to Wavefront.
Configure the Wavefront Proxy to Ingest Logs Data Directly
In this example, we’ll instruct Wavefront on how to parse Combined Apache Logs, which is a common logging format for many web services, e.g. NGINX. This example is merely a starting point; by the end you will see how to ingest metrics from any log format.
In your Wavefront Proxy Config file (wavefront.conf), add these new entries:
2. logsIngestionConfigFile=/etc/wavefront/wavefront-proxy/logsIngestion.yaml
This instructs the Wavefront proxy to listen for logs data in various formats: on port 5044 we listen using the Lumberjack protocol, which works with filebeat.
You use grok patterns (similar to Logstash) to add structure to your log data. To do this, open the logsIngestion.yaml file you specified above (which may be empty), and for now write this example config. It tells the Wavefront Proxy some basic instructions for parsing (explanation below).
1. aggregationintervalSeconds: 5 # Metrics are aggregated and sent at this interval
2.counters:
3.- pattern:’%{COMBINEDAPACHELOG}’
4. metricName: ‘combined_apache_log_lines’ # +1 for every log line matching this pattern
5.
6.
7. gauges:
8. – pattern:’%{COMBINEDAPACHELOG}’
9. metricName: ‘apacheStatus’
10.valueLabel: ‘response’ # Which value should be pulled from the COMBINEDAPACHELOG grok? Instantaneous value of most recently parsed HTTP return response code.
11.
12.
13. histograms:
14. – pattern:’%{COMBINEDAPACHELOG}’
15. metricName: ‘responseBytes’
16. valueLabel: ‘bytes’
17. # A helpful example below, this one won’t parse any nginx logs.
18. – pattern: ‘My operation took %{NUMBER:duration} seconds’
19. metricName: ‘myOperationDuration’
20. valueLabel: ‘duration’
This configuration file is parsed as a POJO, so see its javadoc for more details on every possible field. Log lines are given structure with java-grok, which is exactly the syntax for the Logstash grok plugin.
Then, through valueLabel, you can specify which part of the log line is the actual telemetry you want to send to Wavefront. There are three supported modes of aggregation: counters, gauges, and histograms. See Dropwizard documentation for more.
You can think of grok patterns as regexes with macros. Each macro can be made up of sub-macros, and each macro can bind a substring to a given label. So, as an educational example, consider:
1. LOGLEVEL (INFO|WARNING|ERROR)
2. BASE_FORMAT %{LOGLEVEL:level} %{NUMBER:timestamp}
3. FULL_FORMAT %{BASE_FORMAT} my operation took %{NUMBER:value} seconds.*
FULL_FORMAT above would match a log line like:
1. INFO 1476925272 my operation took 42 seconds (and other info here)
And you would have the level, timestamp, and value bindings. Here are the patterns that ship with the Wavefront Proxy, and you can always add more. See more advanced examples here.
Some notes on specifying patterns:
- Bugs in grok patterns can be frustrating to debug. Try your grok pattern with a sample log line in one of the grok parsing debugger tools (e.g.grok debugger).
- As in the examples above, use single quotes unless you need double quotes. Yaml parsers will escape sequences inside double quotes, which is usually not what you want (e.g. “\n” will be the newline character).
- Also, always remember grok patterns expand to regex patterns. This means if you wanted to capture a number inside brackets, you would need ‘\[NUMBER:myNum\]’ or “\\[NUMBER:myNum\\]” (for point 2 above). A regex debugger may be helpful.
- More thorough examples of grok config files are documented in Wavefront Proxy Javadoc here.
Once you have a 4.1 agent running, you can hot load new logsIngestion.yaml files. Just edit whatever file you specified in wavefront.conf, and look for a log message like this:
If there is a problem, you’ll see a log line like this:
Ship Your Production Log Data with Filebeat
We’ll install Filebeat on nodes for sending log data to Wavefront.
- Note on Ingestion: This walkthrough sets up metrics harvesting with aggregation, so that time series are held in memory and periodically flushed to Wavefront. This allows you to control your points-per-second, and it also allows for you to aggregate the same metric across multiple nodes. However,this comes with the limitation that each individual metric must always arrive at the same Wavefront Proxy. If you only use one proxy you don’t have to worry about this, but if you have a multi-proxy deployment, the easiest way to move forward is to send all of your logs to the same proxy. That way each metric only has one possible pool for aggregation.
- Note on Tagging: Points are automatically given a source tag according to the machine that sent corresponding log data. This is done with Filebeat host metadata — so each host should be able to resolve its own hostname, or else an IP will be used.
We’ll start by installing Filebeat on any production node that has log data you want to send to Wavefront. For Ubuntu:
2. sudo dpkg -i filebeat_1.3.0_amd64.deb
Or, for Redhat:
2. sudo rpm -vi filebeat-1.3.0-x86_64.rpm
The default config file is very well commented and lives in /etc/filebeat/filebeat.yml. For this deployment, we’ll send all of our NGINX logs to our Logstash worker.
2.# Docs: https://www.elastic.co/guide/en/beats/filebeat/current/configuration-filebeat-options.html1.
3. filebeat:
4. prospectors:
5. # Each – is a prospector. Below are the prospector specific configurations
6. –
7. paths:
– /var/log/nginx/*.log
8. input_type: log
9. tail_files: true
10. registry_file: /var/lib/filebeat/registry
11. output:
12.logstash: # Even though we’re sending directly to the WF proxy, we use this. The protocol (Lumberjack) is the same.
13. hosts: [“wavefront-proxy.mycompany.com:5044”] # Replace this with the host:port of your wavefront proxy
14. logging:
15. to_syslog: false
16. to_files: true
17. files:
18. path: /var/log/filebeat
19. name: filebeat.log
20. rotateeverybytes: 10485760 # = 10MB
21. keepfiles: 7
22. # Available log levels are: critical, error, warning, info, debug
23. level: info
You can send log data with:
To make sure Filebeat is sending log data, run:
You should see lines like this:
1. 2016-10-19T22:27:32Z INFO Harvester started for file: /home/ubuntu/foo.log
2. 2016-10-19T22:27:37Z INFO Events sent: 20048
3. 2016-10-19T22:27:37Z INFO Registry file updated. 1 states written.
4. 2016-10-19T22:27:40Z INFO Events sent: 20048
5. 2016-10-19T22:27:40Z INFO Registry file updated. 1 states written.
6. 2016-10-19T22:27:42Z INFO Events sent: 11647
Note that Filebeat keeps a registry file (in the above config, at /var/lib/filebeat/registry). This file tells Filebeat where it left off in the event of a shutdown. To start from a clean state, stop Filebeat, clear this file, and start Filebeat.
On the Wavefront side, you’ll see log messages indicating we found a Filebeat connection (wavefront.log):
1. Nov 21, 2016 11:19:17 AM New filebeat connection
View Your Data
With the above setup, you could issue a query like:
1. rate(ts(combined_apache_log_lines))
2. ts(responseBytes.p99)
Metrics vs. Logs – There’s a Key Role for Both
Metrics and log monitoring are complementary. If you embrace the power of tracking everything that moves in your environment, then you’ve added instrumentation to likely thousands of places across your codebase.
Metrics give you an aggregated view over this instrumentation. Logs give you information about every single request or event.
Metrics are the best place to start dealing with a problem. They’re where to look for trends. They’re also the basis for performance-related alerts.
Combined with well-designed dashboards, they help you to quickly isolate to which subsystem of which application is behaving oddly. From there you can deep dive with profiling tools, data mine your logs and cross-check against the source code itself.
Deploying scalable and reliable monitoring platforms has been the goal of SREs for quite some time. With the ever increasing volumes of both human and machine generated data, the need for such platforms is greater.
Wavefront is optimized for time-series metrics. Now it derives metrics directly from log data as well.
Are you ready to metamorphose the way you monitor your cloud applications? Get started with Wavefront today.
The post Monitoring Metamorphosis: How To Create Metrics from Log Data in Wavefront appeared first on Wavefront by VMware.


