

In my previous blog post about monitoring applications in the serverless world, we discussed how to monitor AWS Lambda functions using the Wavefront Lambda SDK. With only a few lines of code, you get standard and custom business metric emitted directly from your Lambda function to Wavefront. You can visualize those metrics on the pre-built dashboards provided by the Wavefront AWS Lambda integration.
How to Send Custom Business Metrics From Your Lambda Function to Wavefront
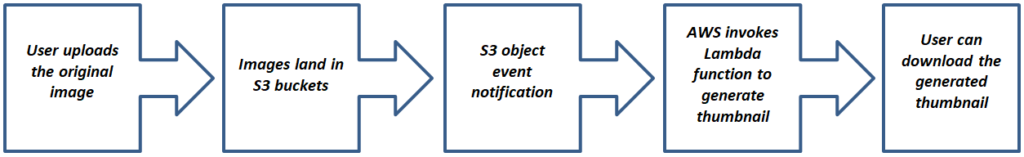
Let’s say you’re writing a Lambda function in Python that generates an image thumbnail. Your function is relying on AWS S3 object event notification. Whenever an image lands in the S3 bucket, your Lambda function is notified and the code in the function handler generates the thumbnail for that image. So the pipeline for your Lambda function looks like this:
Let’s assume the input S3 bucket has a variable number of images. Your service needs to generate thumbnails for those images in the S3 buckets. So by using AWS Lambda, you were very quickly able to build a prototype without worrying about the deployment details.
But now you want to make it production grade – so one of the first questions as a developer is, once you write a function, how will you monitor it? Using the Wavefront Lambda SDK and less than 5 lines of code, you get the standard metrics (listed below) sent directly to Wavefront:
| Metric Name | Description | |
| 1 | aws.lambda.wf.invocations.count | Count of number of Lambda function invocations aggregated at the server. |
| 2 | aws.lambda.wf.invocation_event.count | Count of number of Lambda function invocations. |
| 3 | aws.lambda.wf.errors.count | Count of number of errors aggregated at the server. |
| 4 | aws.lambda.wf.error_event.count | Count of number of errors. |
| 5 | aws.lambda.wf.coldstarts.count | Count of number of cold starts aggregated at the server. |
| 6 | aws.lambda.wf.coldstart_event.count | Count of number of cold starts. |
| 7 | aws.lambda.wf.duration.value | Execution time of the Lambda handler function in milliseconds. |
Your next question is most likely: But what about custom business metrics?
Custom Business Metrics
Custom metrics are often the most useful metrics to track in your application because they can tell you the most about how your business is performing. For that reason, custom metrics are often business metrics.
Let’s look at what business metrics you might want to monitor for this service. Let’s say for example your thumbnail service, each input S3 bucket has a variable number of images and you might want to emit the number of generated thumbnails per function invocation as a counter (let’s call that raw counter metric: “lambda.thumbnail.generate“).
Problems With the Raw Counter
What are the shortcomings if we emit the above value (i.e. the number of generated thumbnails by your Lambda function) as a raw counter?
As per the Wavefront metric data format, we need to emit the data in the following format:
<metricName> <metricValue> [<timestamp>] source=<source> [pointTags]
What value should we emit for the mandatory source field? Let’s assume our AWS Lambda function name is: “lambda_thumbnail_service“.
Option 1: Let’s use the function name (lambda_thumbnail_service) as the metric_source.
Let’s say, there were 3 invocations of such a Lambda function and 3 metric points were emitted with values of 10, 5 and 3. The metric_value here is a count of the number of generated thumbnails.
| 1 2 3 |
lambda.thumbnail.generate 10 source=lambda_thumbnail_service image-format=jpeg lambda.thumbnail.generate 5 source=lambda_thumbnail_service image-format=jpeg lambda.thumbnail.generate 3 source=lambda_thumbnail_service image-format=jpeg |
So we see that three distinct points at the following timestamps were sent to Wavefront: { t1: 10, t2: 5, t3: 3 }, where rate() on those raw values does not make any sense.
The shortcoming of this approach is that we are trying to emit a counter but inadvertently are sending those raw values as a gauge, and the rate() function on a gauge is not defined because rate() should only be used on counters. Furthermore, if we have 2 or more instances of the same Lambda function executing and emitting the metric at the same timestamp, then that will lead to collisions since Wavefront stores those points at a one second granularity. Collisions are likely when your Lambda function handler experiences bursty traffic and a lot of concurrent requests.
Perhaps, using the name of the Lambda function as the source is a bad choice.
Option 2: How about we use UUID, as every Lambda invocation is ephemeral?
Here’s an example of regular counters with ephemeral UUID as the source:
| 1 2 3 |
lambda.thumbnail.generate 10 source=<UUID_1> image-format=jpeg lambda.thumbnail.generate 5 source=<UUID_2> image-format=jpeg lambda.thumbnail.generate 3 source=<UUID_3> image-format=jpeg |
Do you see a serious problem with this approach? We’re creating a new series every time a Lambda function is invoked and emitting only 1 point per series (assuming no UUID collision). Wavefront can handle high data cardinality much better than all other TSDB-based monitoring tools out there, but this approach leads to cardinality that’s off the charts (refer to Wavefront best practices for point tags).
So let’s revisit Option 1, i.e. using a Lambda function name as the metric_source. Assuming we don’t really have high frequency function invocations and no possibility of collisions, can we somehow aggregate the data on the Wavefront side when we query it?
For a use case, let’s say the query that we’re trying to answer is the rate at which the Lambda function is generating thumbnails. Now let’s look at the use case of setting up an alert. AWS Lambda is great at scaling out, meaning if the user uploads lots of images to S3, AWS Lambda will run more instances of your functions in parallel without you ever having to worry about bursty incoming traffic. But what if you want to be notified with an alert when someone is uploading too many images to S3? This equates to: notify me if the rate at which the function is generating thumbnails exceeds, say, 50 images per second. Here, you can apply back-pressure and refuse to generate thumbnails at that rate by tweaking the concurrent function execution limit control.
Will Any Existing Wavefront Query() Functions Help Me With This?
Let’s say you go with Option 1 and emit three distinct points at the following timestamps: {t1: 10, t2: 5, t3: 3}.
Let’s look at the sum() and rawsum() functions. What if we invoke the sum(ts(“lambda.thumbnail.generate”)) query. Well, that’s not going to help here because sum() returns the sum of all series and we really have only one series here. Similarly, rawsum(ts(“lambda.thumbnail.generate”)) is not going to help us here. What if we use the integral() function – “Returns the moving sum over time for the given time series expression over the time interval of the current chart window. Always starts at 0 on the left side of the chart showing the total accumulation over the time duration of the current chart window.”
Well, that certainly looks promising. Indeed, integral() will add all the points for a given time window that encompasses timestamps t1, t2 and t3 above and will return you the aggregate of that value.
And you can certainly do: rate(align(1m, mean, integral(ts(“lambda.thumbnail.generate”))))
But there are also several problems with this approach:
- The integral() query is always time-sensitive, i.e. it provides a moving sum over the time interval of the current query window and the value will change if we change the query time window.
- For bursty traffic, collisions are inevitable, and integral() is not going to help you with that. If we lose points, the rate() of that Lambda function metric will be inaccurate.
- Creating an alert for the above use-case is not straightforward because the integral() query is time-sensitive.
Introducing Delta Counters
So, at Wavefront, while we brainstormed our solution to correctly monitoring serverless applications, we realized that instead of doing the aggregation inside a query function, what’s needed was the ability to report delta counters that can be aggregated in the Wavefront cloud at the time of ingestion. That is, if someone sent us 3 distinct points – {t1: 10, t2: 5, t3: 3}, the final point that’s stored on Wavefront should be 10 + 5 + 3 = 18.
So we built exactly such a service from the ground up that helps us monitor AWS Lambda and other serverless applications. A delta counter is a new metric type, a special counter that’s aggregated on the cloud (server) side. Applications need only send the increment value a.k.a. delta value without worrying about aggregating it and then sending it to Wavefront. A delta counter metric is prefixed with ∆
| 1 2 3 |
∆lambda.thumbnail.generate 10 source=lambda_thumbnail_service image-format=jpeg ∆lambda.thumbnail.generate 5 source=lambda_thumbnail_service image-format=jpeg ∆lambda.thumbnail.generate 3 source=lambda_thumbnail_service image-format=jpeg |
In this case, the name of the metric ingested on Wavefront is lambda.thumbnail.generate” (without the ∆ prefix) and the final value of metric will be 10 + 5 + 3 => 18. Also, the final timestamp of the point is when the delta point was aggregated in the Wavefront cloud.
Along with custom metrics, we also use delta counters in the Wavefront Lambda SDK. The following standard metrics that you saw earlier are actually reported as delta counters by the SDK.
| Metric Name | Type | Description | |
| 1 | aws.lambda.wf.invocations.count | Delta Counter | Count of number of lambda function invocations aggregated at the server. |
| 2 | aws.lambda.wf.errors.count | Delta Counter | Count of number of errors aggregated at the server. |
| 3 | aws.lambda.wf.coldstarts.count | Delta Counter | Count of number of cold starts aggregated at the server. |
Why Delta Counters Are the Right Way to Monitor Serverless
You need delta counters to correctly monitor serverless applications for several reasons:
- You don’t have to worry about collisions. Everything is aggregated on the server side including two or more points for the same series with the same timestamp.
- All your queries work correctly. For example, you can do, rate(ts(delta_counter_name)), just like rate(ts(raw_counters)).
- You can ingest delta counters at rates massively higher than Wavefront’s already high ingestion rate of millions of PPS for regular metrics.
- You can easily write an alert condition just like you do for rate(ts(raw_counter)) > threshold_value.
- Your query performance remains as lightning fast as when querying – same as querying any other ingested raw counter – as none of the aggregation happens inside the query function.
Delta Counters Do Have a Few Caveats
There are a couple of things to keep in mind when you’re using Wavefront delta counters. First, if delta counters are emitted with a certain timestamp, then that’s not the final timestamp at which the point is stored in Wavefront. Remember, the final timestamp is the time at which the points were aggregated in the Wavefront cloud.
Second, delta counters are reported every minute for the next 1 hour until the source stops reporting the counter. If the source (client/customer) does not report for more than 1 hour, then the counter is reset to 0 and is no longer aggregated in the Wavefront cloud.
Beyond Serverless
What you can observe here is that the delta counter is a powerful metric type that will help you monitor not only AWS Lambda functions (serverless apps), but also any applications that emit two or more instances of the same series from different sources.
Here are some scenarios where you can have multiple sources emitting the same series, that Wavefront and delta counters can aggregate for you:
- While the StatsD protocol is the go-to mechanism to aggregate counters for a given Telegraf instance, what if you want to aggregate a counter across multiple Telegraf instances? Delta counters solve this problem.
- What if you want to aggregate counters across ephemeral containers? Using those ephemeral container IDs as sources will cause the same high cardinality problems. Delta counters with the name of the container solve this problem.
- What if you have regular counters in multiple applications sitting behind a load balancer. All of those regular counters are incremented independently at their respective cadence, but what you really want to report is the aggregate value across all those applications. Delta counters solve this problem.
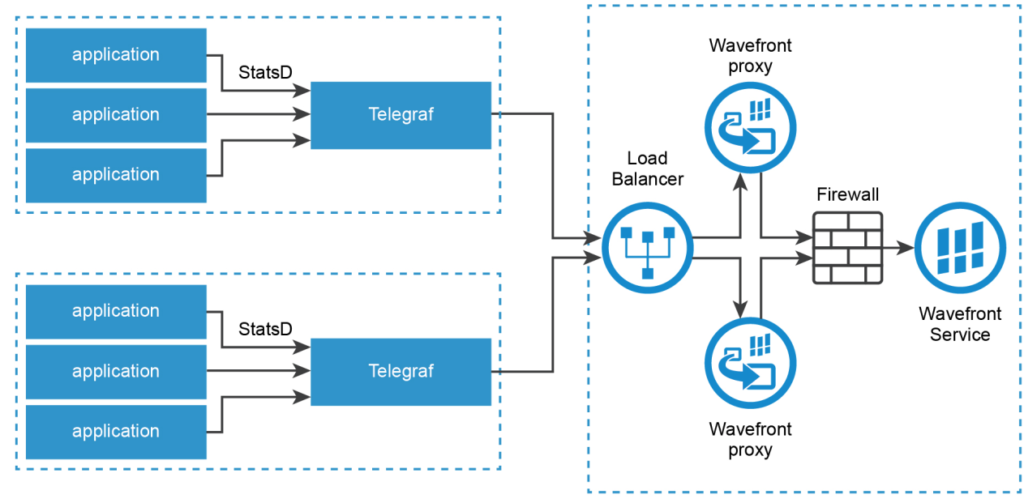
In the diagram above, let’s say you have a shared counter coming from different stateless applications that are reporting that counter to the local Telegraf instance on that node. With the help of delta counters, you can easily aggregate counters from those applications across different Telegraf instances. Since the stateless application is ephemeral, it makes sense to report the application name as the source tag for that shared counter. If we do, we quickly realize that we have to aggregate the value of the emitted counter from those apps across Telegraf instances. If such a counter is reported to multiple Wavefront proxies sitting behind a load balancer, then it’s clear in the metric pipeline that the responsibility to aggregate those values should be pushed as far right as possible. That shared counter will be emitted as a delta counter, and the aggregation of the value for that delta counter will happen in the Wavefront cloud at the time of ingestion.
Conclusion
Using Wavefront delta counters, you can now automatically aggregate metrics across AWS Lambda, across any serverless app, and across multiple Telegraf instances, even across multiple Wavefront proxies sitting behind a load balancer. At Wavefront, we used delta counters to aggregate counters across multiple apps for our logs to metrics Wavefront integration, pushing the responsibility for aggregation to the Wavefront cloud. All we did was switch from raw counters to delta counters in our logs to metrics integration and report those deltas to Wavefront. Then let Wavefront do all the heavy lifting of aggregating the metrics for you!
Wavefront Lambda SDK and delta counters for serverless applications are available today. Give the Wavefront free 30 day trial a try today.
(Click here to read Part 1 of this blog)
Get Started with Wavefront Follow @sushantdewan Follow @WavefrontHQThe post Monitoring Apps in the Serverless World (Part 2): Introducing Wavefront Delta Counters appeared first on Wavefront by VMware.


