

When supporting some of the world’s largest and most successful SaaS companies, we at Wavefront by VMware get to learn from our customers regularly. We see how they structure their operations, how they implement their monitoring and automation policies, and how they use smarter alerts to lower mean time to identify and mean time to automate.
In part 1, I discussed concepts such as simple vs. smart alerts, anomaly definition, metric-based vs. logs-based anomaly detection, and the value of an expressive language for using analytics to find anomalies specific to your cloud application environment. In part 2, and part 3, I dug into ten smart alerting examples used by top SaaS companies.
In this final part, I’ll uncover the common theme across all these metrics-based anomalous conditions that can power smarter alerts. At the end, using a simple anomaly example, I’ll show the importance of measurement granularity, no historical roll-ups of telemetry, and super fast at-scale queries for anomaly detection alerts.
But first, we’re going up to 11! Here is one more example of metrics-based anomaly detection, one that can build upon the previous 10.
11. Alerting on Any Boolean Combination or Functional Composition
You can take any boolean combination or functional composition of any of these functions that I’ve shown so far and combine them together. Here in Figure 1, are two custom alert definitions one of our customers uses in production for early detection of a complex, real-world anomaly.
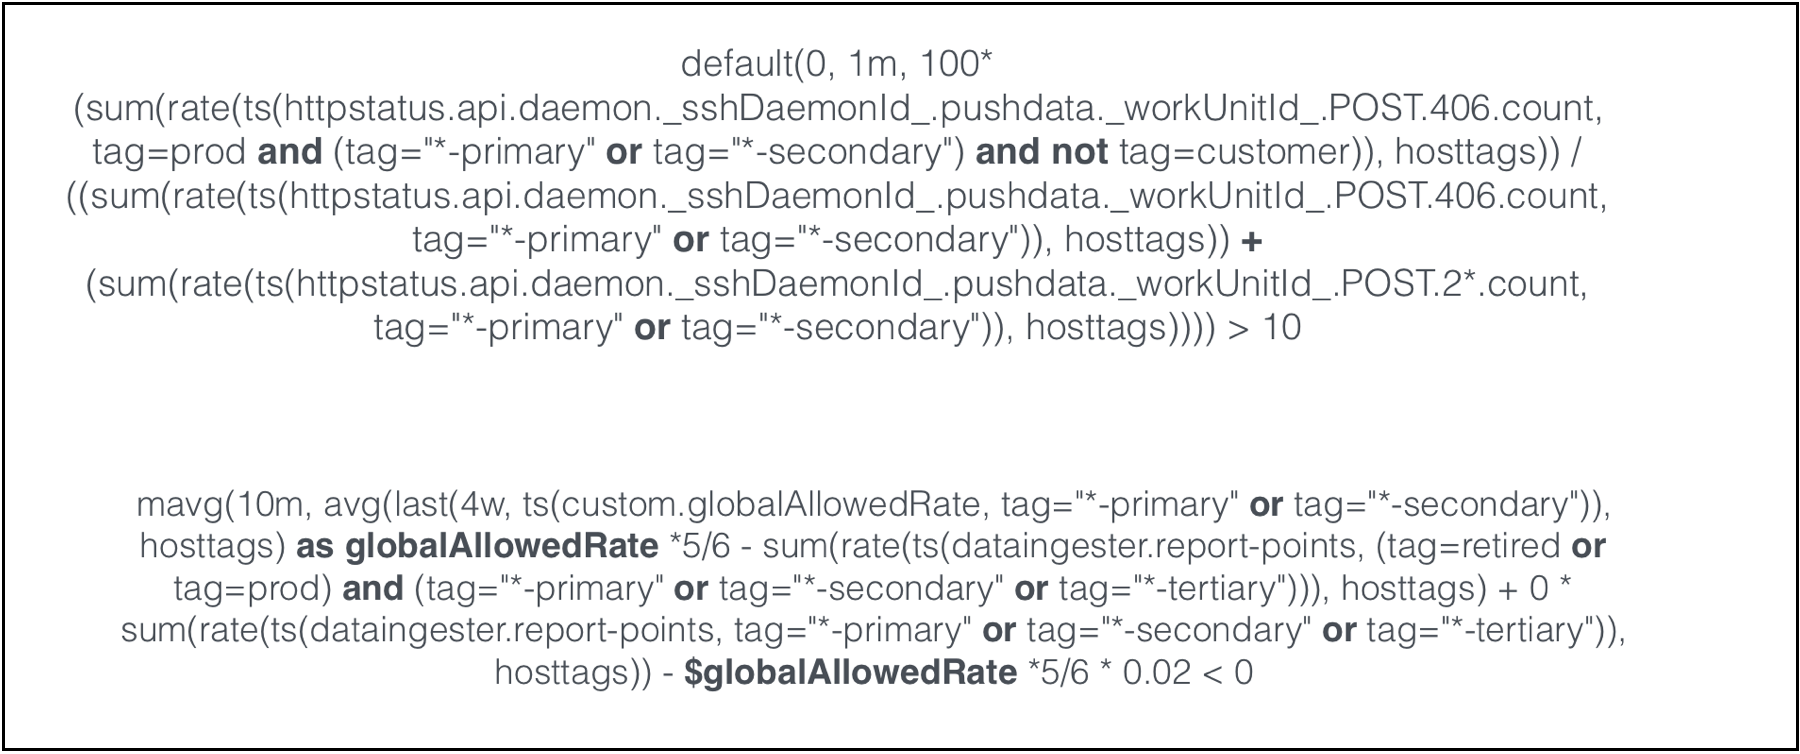 Figure 1. Two Custom Alerting Examples Using Boolean Functional Combinations
Certainly these are two advanced alert examples, and not every production alert is this advanced. But some of our customers have created such alerts because their normal-environment is complicated and they want to define advanced smart alerts that accurately identify a specific anomaly without false positives.
Importance of a Powerful Query Language: Combining Range with Behavioral Differences
Not all anomalies are considered equal. There is one anomaly type that is more fundamental – and therefore more useful – than the others. That is the range anomaly. When you use a simple range to see what is not normal – by searching for data outside static high or low thresholds – you lay the foundation for any other more “smart” alert definition.
In all of the metrics-based anomaly examples discussed earlier, I basically did this:
- Compared behavioral differences, which were sometimes quite complex
- Transformed behavioral differences with analytical functions to compare value differences
- Examined the new, transformed data to see whether it falls into some new, simpler, static range
So in essence, you use analytics to reduce all these anomalies into defined ranges of good and bad. You do this by using analytics to quickly identify extreme or unusual behaviors and transform them – with analytics – into a range that exposes the extreme value.
That is why the query language is so important. Your ability to detect anomalies – to express what anomaly means — is directly limited by how powerful query language is. Wavefront’s query language has 120+ analytics functions to manipulate the data stream and transform behavioral differences into value differences, in even the most complex of environments. Thus, good and bad ranges are used to trigger highly intelligent alerts upon which you can take corrective action.
In essence, all of this is not really about the software or math. It’s about us, and it’s about psychology. Human beings are attuned to positional outliers. In Figure 2, you focus on the tallest owl and the biggest penguin without blinking. But you don’t have that kind of visual instinct for large sets of data behaviors.
 Figure 2. Human Beings are Attuned to Positional Outliers Without Blinking
For example, can you find which of fifty series shown in Figure 3 is reporting least frequently? The data is there for you to see, but no one can do that without analytics. Unless you are Rain Man. 
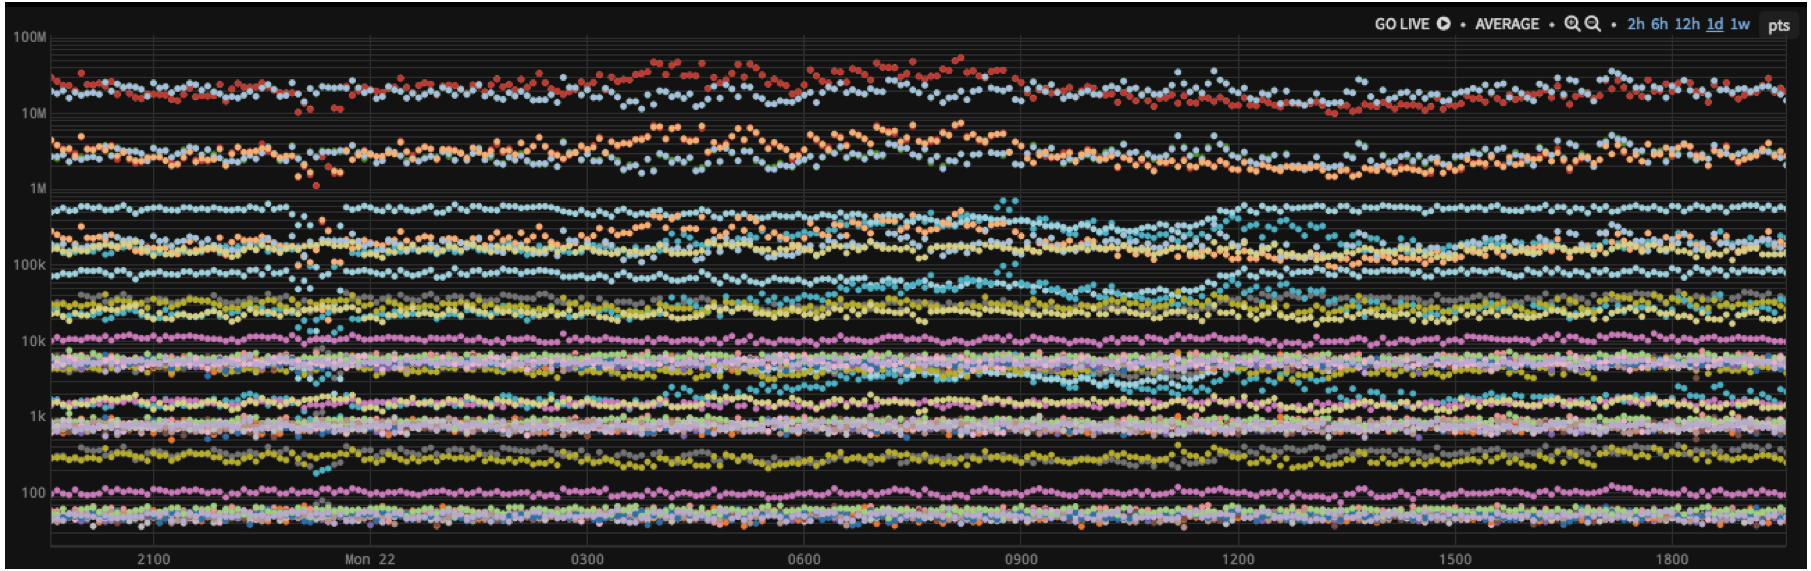 Figure 3. Can You See Which Series Is Reporting Least Frequently?
And that’s why analytics – and alerting on a strong foundation of analytics – is so critically important today to monitoring of cloud-native applications.
Importance of Granularity, No Roll-Ups, and Fast At-Scale Queries for Anomaly Detection
Let’s now look at simple anomaly detection in action. A year-long series of two CPU load metrics is shown in Figure 4. In Wavefront, with each series reporting once a minute, approximately a million points are near-instantly pulled out of the storage and displayed.
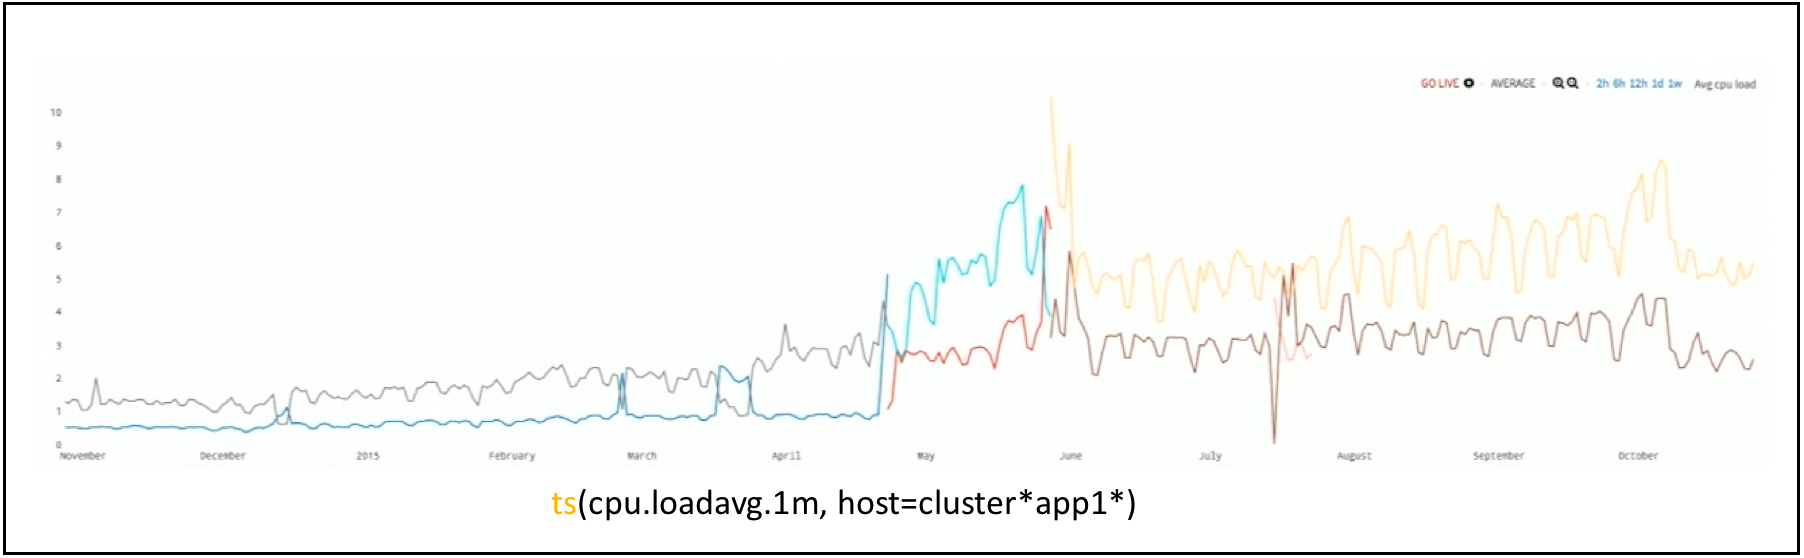 Figure 4. A Year-Long CPU Load Data
It takes Wavefront about a second to average every single minute across a year. You might think you’ve seen a year-long of metrics as shown in Figure 5 before, and there is nothing unusual in it. But if you look at the series values, they go from 1 to 2, to about 4 or 5 – a very low key, undramatic chart. But this chart is deceiving you. It’s hiding something from you. There is an incident that you can’t see on the chart.
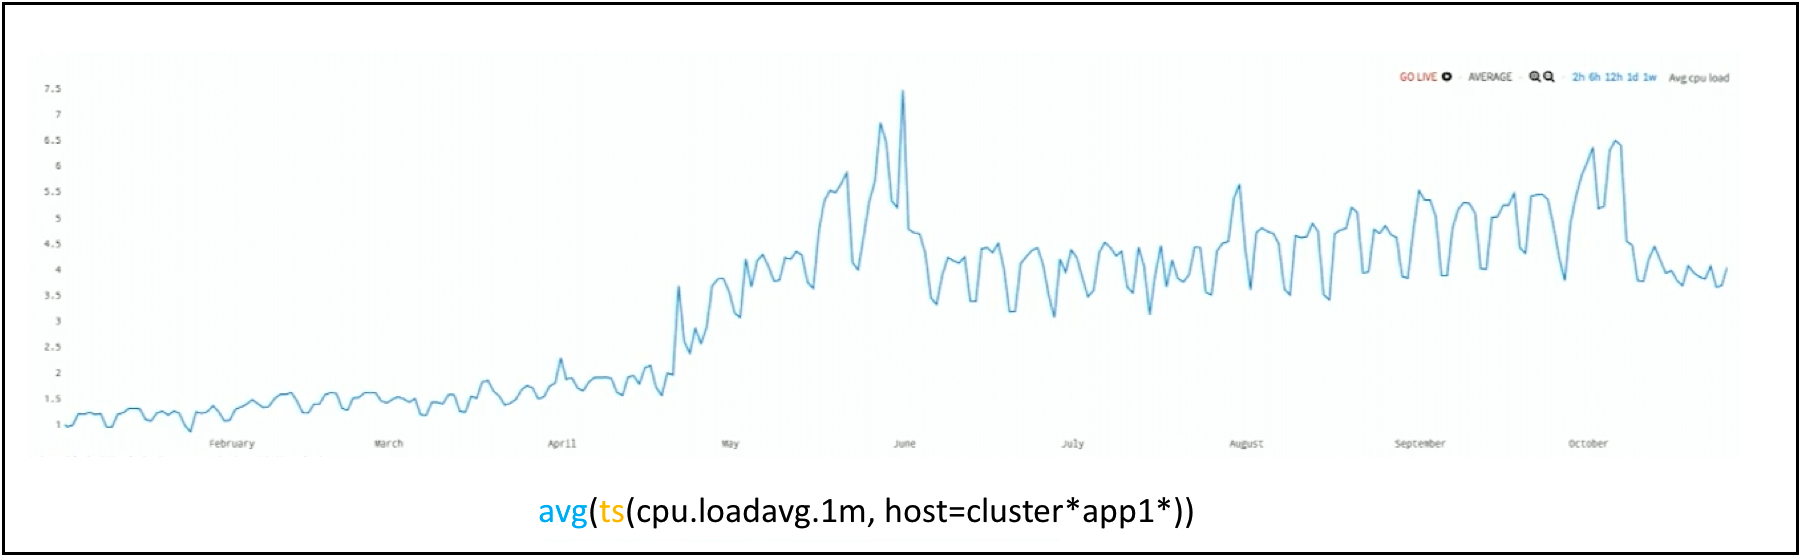 Figure 5. An Average of Year-Long CPU Load Data
Some other monitoring tools will summarize or roll up the data. For example, after seven days, they down sample the raw data into summarized hourly or daily averages. The premise is that, the detail on what happened a year ago, is not essential. We at Wavefront disagree, and we keep all metrics data at full resolution. You might ask who cares and why is this important? Here’s why. I can instead summarize data at the time of the query. All data detail is stored, and when you want to change the way you look at data, all you have to do is change the query to see outliers. Now, as you can see in Figure 6, the anomaly jumps out at you. The CPU load did not go from 1 to 5. It spiked to 90 and then dropped back down. But that 90 got averaged away during the summarization.
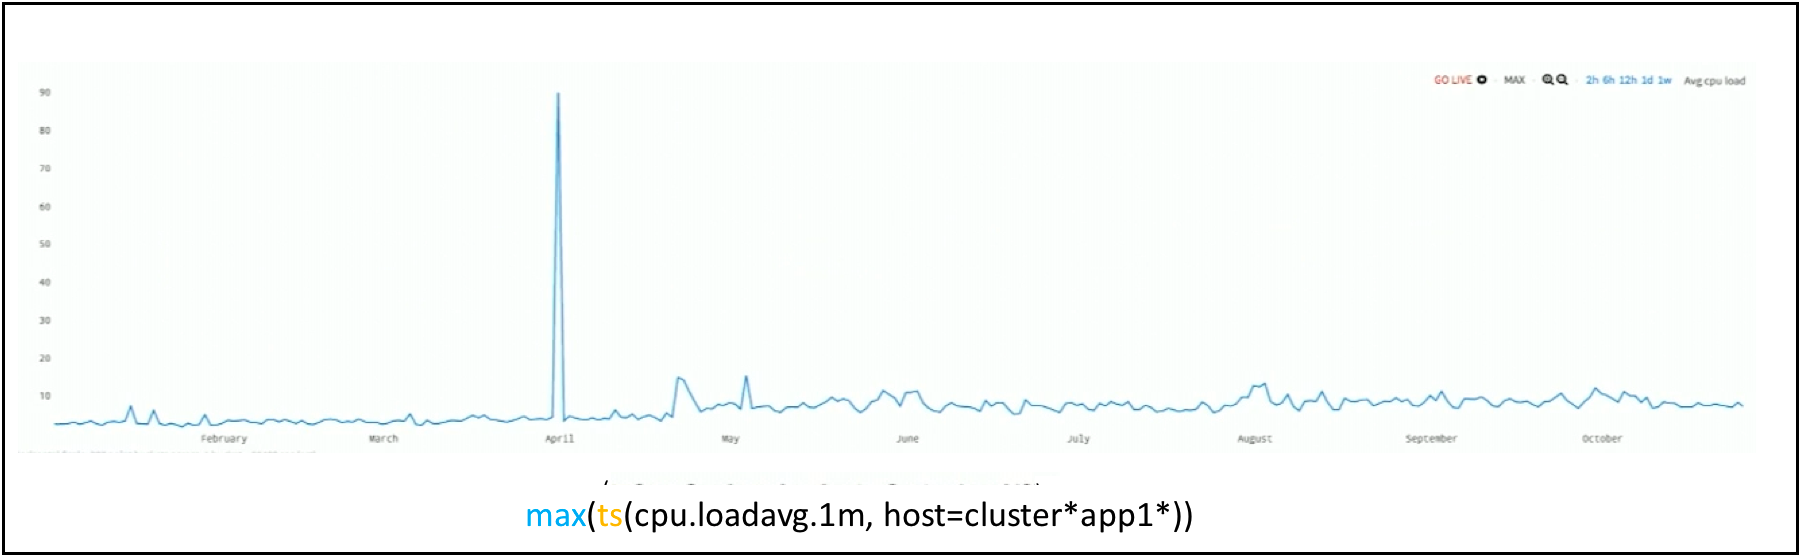 Figure 6. Anomaly Detected with Max Function at the Query Time
If you zoom into the spike as shown in Figure 7, you can see that spike lasted 7 minutes. In a second, Wavefront allows you to view this 7 minute spike within a year-long chart.
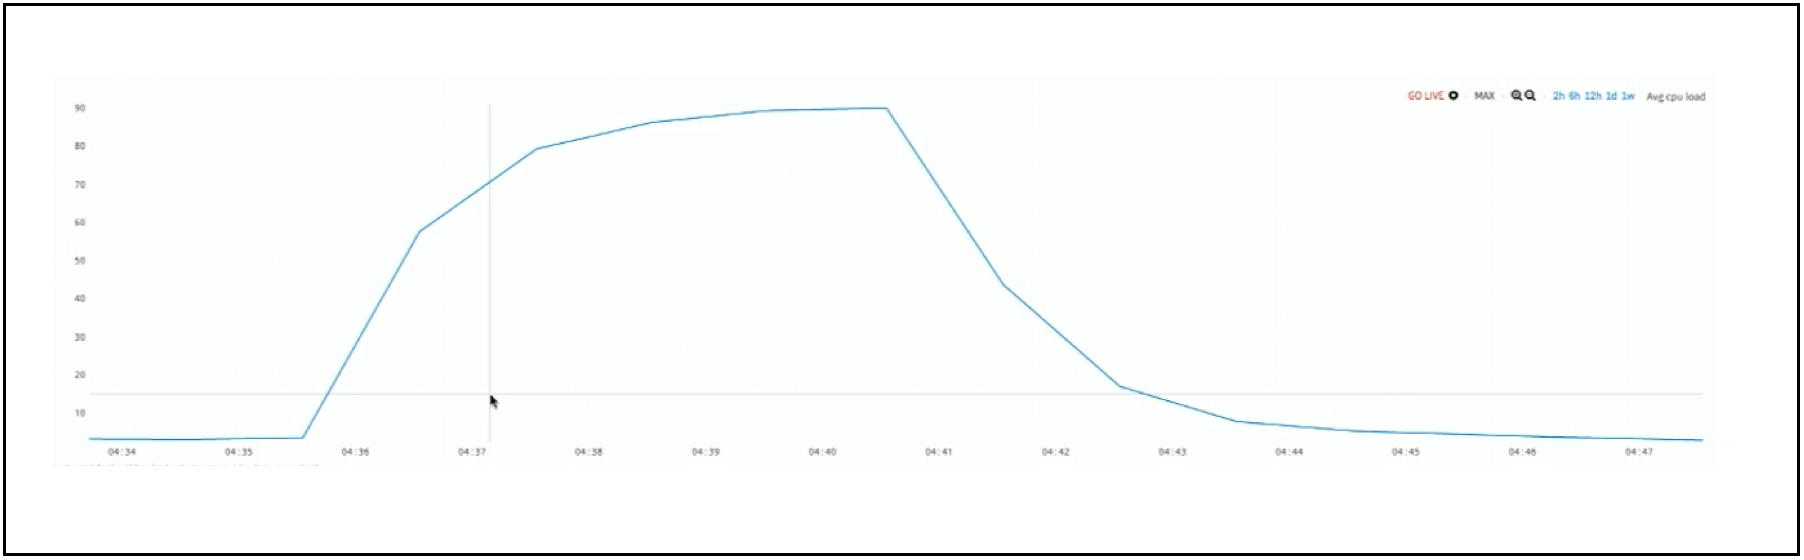 Figure 7. Zoomed CPU Load Anomaly
And that’s why analytics with full fidelity data storage – and alerting on a strong foundation of analytics – is so important today to cloud-native application monitoring. Ready to give Wavefront a test drive? Sign up now for our free trial.
Get Started with Wavefront Follow @mikempx Follow @WavefrontHQThe post How to Auto-Detect Cloud App Anomalies with Analytics: 10 Smart Alerting Examples – Part 4 appeared first on Wavefront by VMware.
About the Author
More Content by Mike Johnson


