

The simplicity of applications executing on a single OS and server is long gone.
Now we write for a multitude of machine instances on top of dynamic cloud environments, and the infrastructure is increasingly complex.
Applications execute over distributed architectures and micro-services, interplaying with a mass of infrastructure-as-code and virtualized services. What could possibly go wrong?
Lots – that’s no surprise. Given this, how are your Dev and Ops teams going to manage the chaos of so many moving parts? Nobody can afford to get continuously bogged down with unplanned fire-fighting.
This is especially true in the age of cloud applications, continuous innovation through DevOps, and the simple need to move faster.
Early Internet SaaS leaders were first to experience these challenges, and they pioneered a different approach to improving application performance – one that’s data-driven and based on metrics.
By developing business-relevant analytics from these metrics and putting them into daily use, they improved operational performance, productivity, and customer experience.
But they also had to figure out how to implement this at scale: how to define and use metrics, what data to collect, where to assemble the data, and how to empower everyone with their use.
Initial heavyweight web companies like Google, Facebook, and Twitter were first with these concepts. Adoption grew, and a new generation of SaaS leaders – Workday, Box, Lyft, DoorDash, Yammer, and others – expanded upon the techniques.
As these online businesses blazed new trails, they had much to learn along the way, and we surveyed them to better understand their experiences.
What follows are five key lessons learned from the pioneers of data-driven cloud operations.
1. They foster a data-driven, analytics-enabled culture across the organization.
Culture is about how organizations evaluate performance, allocate resources and encourage people to act. Cultures built on data and analytics are directly linked to high-performance organizations.
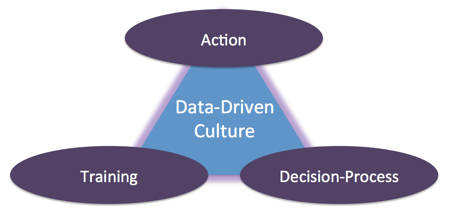 Key Components of Data-Driven Culture
Metrics are already available across a cloud applications environment. What’s needed is a willingness to change culture within Dev and Ops organizations in order to leverage those metrics. That means:
- Training and incentivizing teams to uncover new insights – from changes in customer behaviors to emerging operational performance threats to subtle shifts in operational outputs;
- Acting on those insights – often in real-time and outside the constraints of traditional review cycles or hierarchical authority structures; and
- Moving away from risky, “gut-feel” management styles to data-driven and analytics-enabled models.
2. They build models to determine what operational metrics best track customer experience and business effectiveness.
Data is essential – what gets measured gets done. But not all data is equally reflective of customer experience and business effectiveness.
While there are certain metrics that work well for specific job roles, you may need new metrics and combinations of metrics to ensure that end-to-end business objectives are met.
Such modeling starts with a systems perspective – a full understanding of the cloud application environment as well as which application metrics reflect customer experience and which underlying system operational metrics affect the application.
From these analytical models, Dev and Ops teams can assess and optimize the outcomes of production code based on performance improvements that emerge.
It’s also important to define specific “business” or “custom” metrics that relate directly to the application. These metrics go beyond common infrastructure and domain-specific monitoring metrics.
They are usually customized to a business application, and they may need to be instrumented into the application code directly. Once in place, they are tracked continuously, and they should also be the basis of actionable alerts.
Examples of such business metrics are: 10 minutes passing with no sign-ups or no activity on orders; the number of unresolved customer tickets rising above a rolling threshold; a rise in uncompleted orders by a standard deviation above its seasonal baseline.
These directly indicate a degradation of customer experience and business effectiveness.
The most effective models start not with the data, but with a business opportunity or problem. The task then becomes understanding how the model can improve performance.
Such hypothesis-led modeling leads to faster problem diagnosis and process optimization, pulled from smart data discovery that is more broadly understood by managers.
3. They gather metrics from all corners of their environment.
While business metrics are selected and instrumented judiciously, they ride above lower-level operational metrics that measure every possible operational aspect at every layer of the overall cloud stack.
Example metrics might be utilization on a load balancer, available memory on a server, or the request rate on a database.
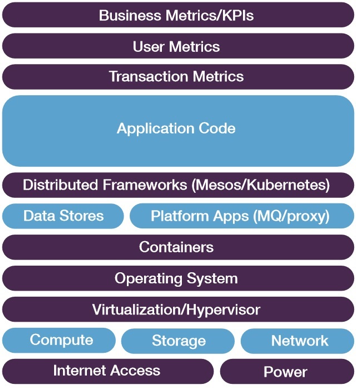 Full Cloud Stack of Metrics
If these lower-level metrics fall out of normal range, it’s difficult to relate them, in isolation, to the overall experience that users are having with an application.
But the wealth of operational metrics provides a means of tying business-level alerts back to the underlying causes – the first step towards fixing a problem.
There are plenty of agent tools for collecting metrics all across the cloud stack. A few open source examples are CollectD and Telegraf, with their large library of plugins, and StatsD, for extracting metrics from application logs.
The trick is to easily relate infrastructure metrics with business metrics for correlation and root cause remediation.
4. They aggregate metrics to one place with common analytics tools for all.
To increase data value and relevancy, data-driven cultures aggregate and organize all their metrics into a single, unified data store.
Having it all in one place accelerates the finding and visualizing of relevant insights in huge amounts of data (i.e. where correlations are hidden).
They also make the unified data available for all. Without this, different groups collect different, patchy or overlapping data sets, each stored in disparate repositories. When it comes time to relating data from multiple silos, problems abound from challenges with access, format, consistency, and response.
With a unified repository for all metrics, every stakeholder – techops, SREs, developers, devops, managers – works with the same, complete set of data. This increases transparency and collaboration across teams. Learning also accelerates with greater sharing of experiences and ideas across teams.
5. They use metrics-driven monitoring at every stage of the operational continuum.
Finally, data-driven cloud ops pioneers unlocked the value of metrics monitoring beyond its obvious use in reactive fire-fighting.
Instead, they applied their data-driven insights toward more proactive and preventative improvements, across all stages of the operational continuum.
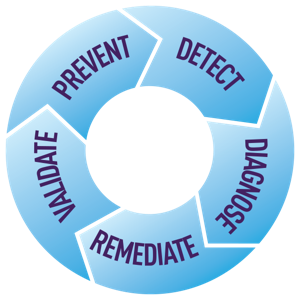 Stages of the Operational Continuum
Beyond the Detect & Diagnose stages of operational management, they applied their data to the Validate & Prevent stages as well.
Time-series metrics gave them insights into longer-term, evolving trends, allowing them to be more predictive. They also used the data to continually maintain the accuracy and intention of their alerting.
As well, they initiated more code optimization projects, using the metrics data to quickly see the before-and-after impact of their code iterations.
All the answers lay somewhere in the data. From this, support teams used the data to detect and fix customer incidents. Operations teams (and increasingly devops and developers) used the data to improve site reliability and resolve bugs in production code.
Product decision-managers used the data to improve the product proactively. Development teams used the data to keep productivity high and to further optimize code for production.
Continuous Innovation is Grounded in Metrics
Driven by data, you can continually question, reevaluate, and refine everything about your business in the cloud.
Keep in mind that you will need to reassess and adjust your key metrics set as your business priorities, adoption trends, and operating conditions evolve. Every week, month, and quarter is a new opportunity to calibrate operational metrics that will drive performance improvements.
When you invest time and resource into modeling, monitoring, sharing, and acting on your metrics, you’ll be amazed at how much more tuned-in you will be to the state of your cloud business, and how much more easily you can make the critical decisions that can catapult your operational success.
With the unified visibility of the right metrics to the right set of eyes, every “problem” provides an opportunity to even better applications performance and customer experience – continuous improvement is an endless journey.
Once you have clear visibility into what’s happening in every corner and layer of cloud environment, you can respond quickly to aberrations –averting many failures altogether when you see it coming.
You’ll meaningfully improve your customers’ experience, and they’ll love you for it. You’ll also earn a reputation for being proactive, responsive and quality-focused.
The metrics are all around you; but like the data-driven cloud pioneers, you can uniquely turn them into a real competitive advantage.
To get started with the Wavefront metrics-as-a-service platform, click here.
The post Five Lessons from Pioneers of Data-Driven Cloud Operations appeared first on Wavefront by VMware.


