

We’re always looking for new ways to give visibility into complex architecture using Wavefront.
One of the most important recent innovations in software architecture is the container. Wouldn’t it be great if Wavefront gave you insight into each of your Docker containers independently? (Spoiler: It can!)
Read the how-to from one of our engineers, originally published on The New Stack……
How to Monitor Containers with cAdvisor and Wavefront
With Docker adoption reportedly doubling last year alone, it should be no surprise that the need for container monitoring is increasingly pressing. While containers have numerous benefits and can help simplify many tasks, they also introduce an extra layer of granularity and interdependency. This is why it is important to have visibility into running containers.
Surprisingly, until somewhat recently, there were no straightforward methods for monitoring resource metrics of Docker containers.
The Docker Stats API, which was introduced with Docker 1.5, introduced the ability to stream resource metrics from containers such as CPU and memory usage. And there has also been numerous other open source efforts to address container monitoring, including Google’s cAdvisor project.
The tool, cAdvisor, is “a running daemon that collects, aggregates, processes, and exports information about running containers. Specifically, for each container it keeps resource isolation parameters, historical resource usage, histograms of complete historical resource usage and network statistics. This data is exported by container and machine-wide,” according to the project’s GitHub page,
Running cAdvisor
One of the best attributes of cAdvisor is how easy it is to run. Since it runs in a container itself, you can spin it up just like any other Docker container with predictable and consistent results. It is also packaged with several “storage drivers” out of the box. When storage driver parameters are passed, it will automatically export resource metrics to the storage driver. For example, the command below will create an instance of cAdvisor on any Docker host, and export resource metrics to a StatsD server.
docker run \
--volume=/:/rootfs:ro \
--volume=/var/run:/var/run:rw \
--volume=/sys:/sys:ro \
--volume=/var/lib/docker/:/var/lib/docker:ro \
--publish=8080:8080 \
--detach=true \
--name=cadvisor \
google/cadvisor:latest \
-storage_driver=statsd \
-storage_driver_host=your_statsd_host:8125 \
-storage_driver_db=docker001
Viewing Container Metrics in Wavefront
Recently, we consolidated several services we had running for demos and related functions onto new servers. When we performed this task, we decided that we wanted to redeploy using Docker. By isolating each service in a container, we’re able to simplify the deployment and scaling process in the future. Using cAdvisor, we’re also able to isolate resource metrics for each container. This is especially useful when you have multiple containers running on the same host – which we have, in this case.
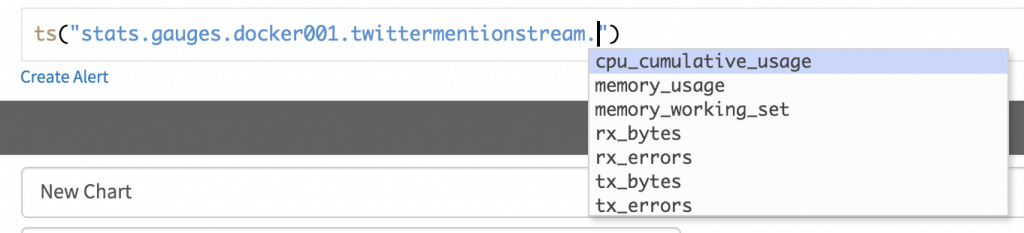
Using the command shown above, cAdvisor immediately starts emitting metrics to a StatsD server. The metrics are created with the following naming scheme:
stats.gauges.<storage_driver_db>.<container name>.<metric name>
Storage_driver_db is an arbitrary name for your docker host that is passed to the run command for cAdvisor. In this case, we used docker001
CAdvisor also provides storage metrics, but that can be trickier to monitor if you’ve mounted volumes to your containers.
Comparing Container Resource Usage
One of the services we moved was a Twitter streaming application. The Twitter streaming application (“twittermentionstream” in the chart below) was only streaming tweets from a handful of support accounts. The total rate of tweets being ingested was less than 0.2 per second even during normal peak Twitter hours. Still, it was the largest user of CPU amongst our containers: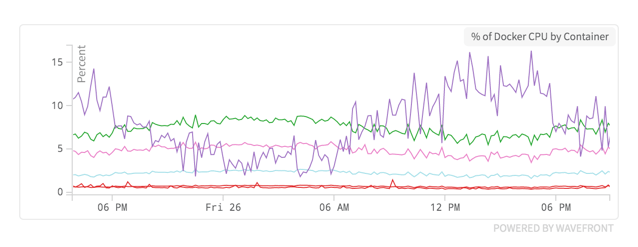
This chart is showing the percentage of CPU being used by each container.
Shortly after the migration occurred, we added several Twitter accounts to the app. This increased the total rate of tweets to over eight tweets per second, a 40-fold increase. Not surprisingly, a 40-times increase of tweet ingestion rate does have a large impact on resource usage.
Container CPU Load after increasing tweet ingestion rate by 40 times.
Getting this information required zero instrumentation other than running cAdvisor. If you isolate your apps in containers, you can see exactly what the impact of your changes are in CPU, memory, and throughput. We’re only looking at CPU here, but other metrics displayed similar behavior.
Capacity Planning Using Container Metrics
Let’s say we wanted to add some more Twitter accounts to the streaming app. We know from our previous chart that the Twitter streaming app is using close to 40 percent of the server’s CPU at ~8 tweets per second. We want to measure how much of a correlation there is between CPU usage and Tweet rate.
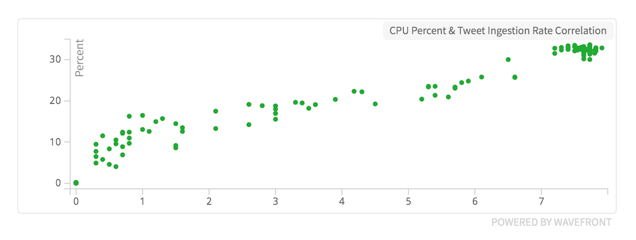
Correlation between CPU Usage and tweet ingestion rate.
This chart shows a linear correlation between tweet ingestion rate and CPU Usage. We could use this line to predict how many tweets this server could handle before reaching 100 percent CPU usage.
In the old days, exploring data relationships meant having a solid grasp of statistics and perhaps a little code. In Wavefront, it takes two clicks (see our Data Explorationexample).
Conclusion
Container adoption is a mega-trend that we don’t see slowing down anytime soon. We will continue to evaluate and blog about developments and trends as more people (and ourselves) ask how to get better visibility into containers. Google’s cAdvisor provides an extremely fast, easy, and effective method to get resource metrics from your containers into Wavefront.
The post How to Monitor Containers with cAdvisor and Wavefront appeared first on Wavefront by VMware.


